What if I had a 20 kWh battery? Simulating 3 years of electricity data
Blog post #36
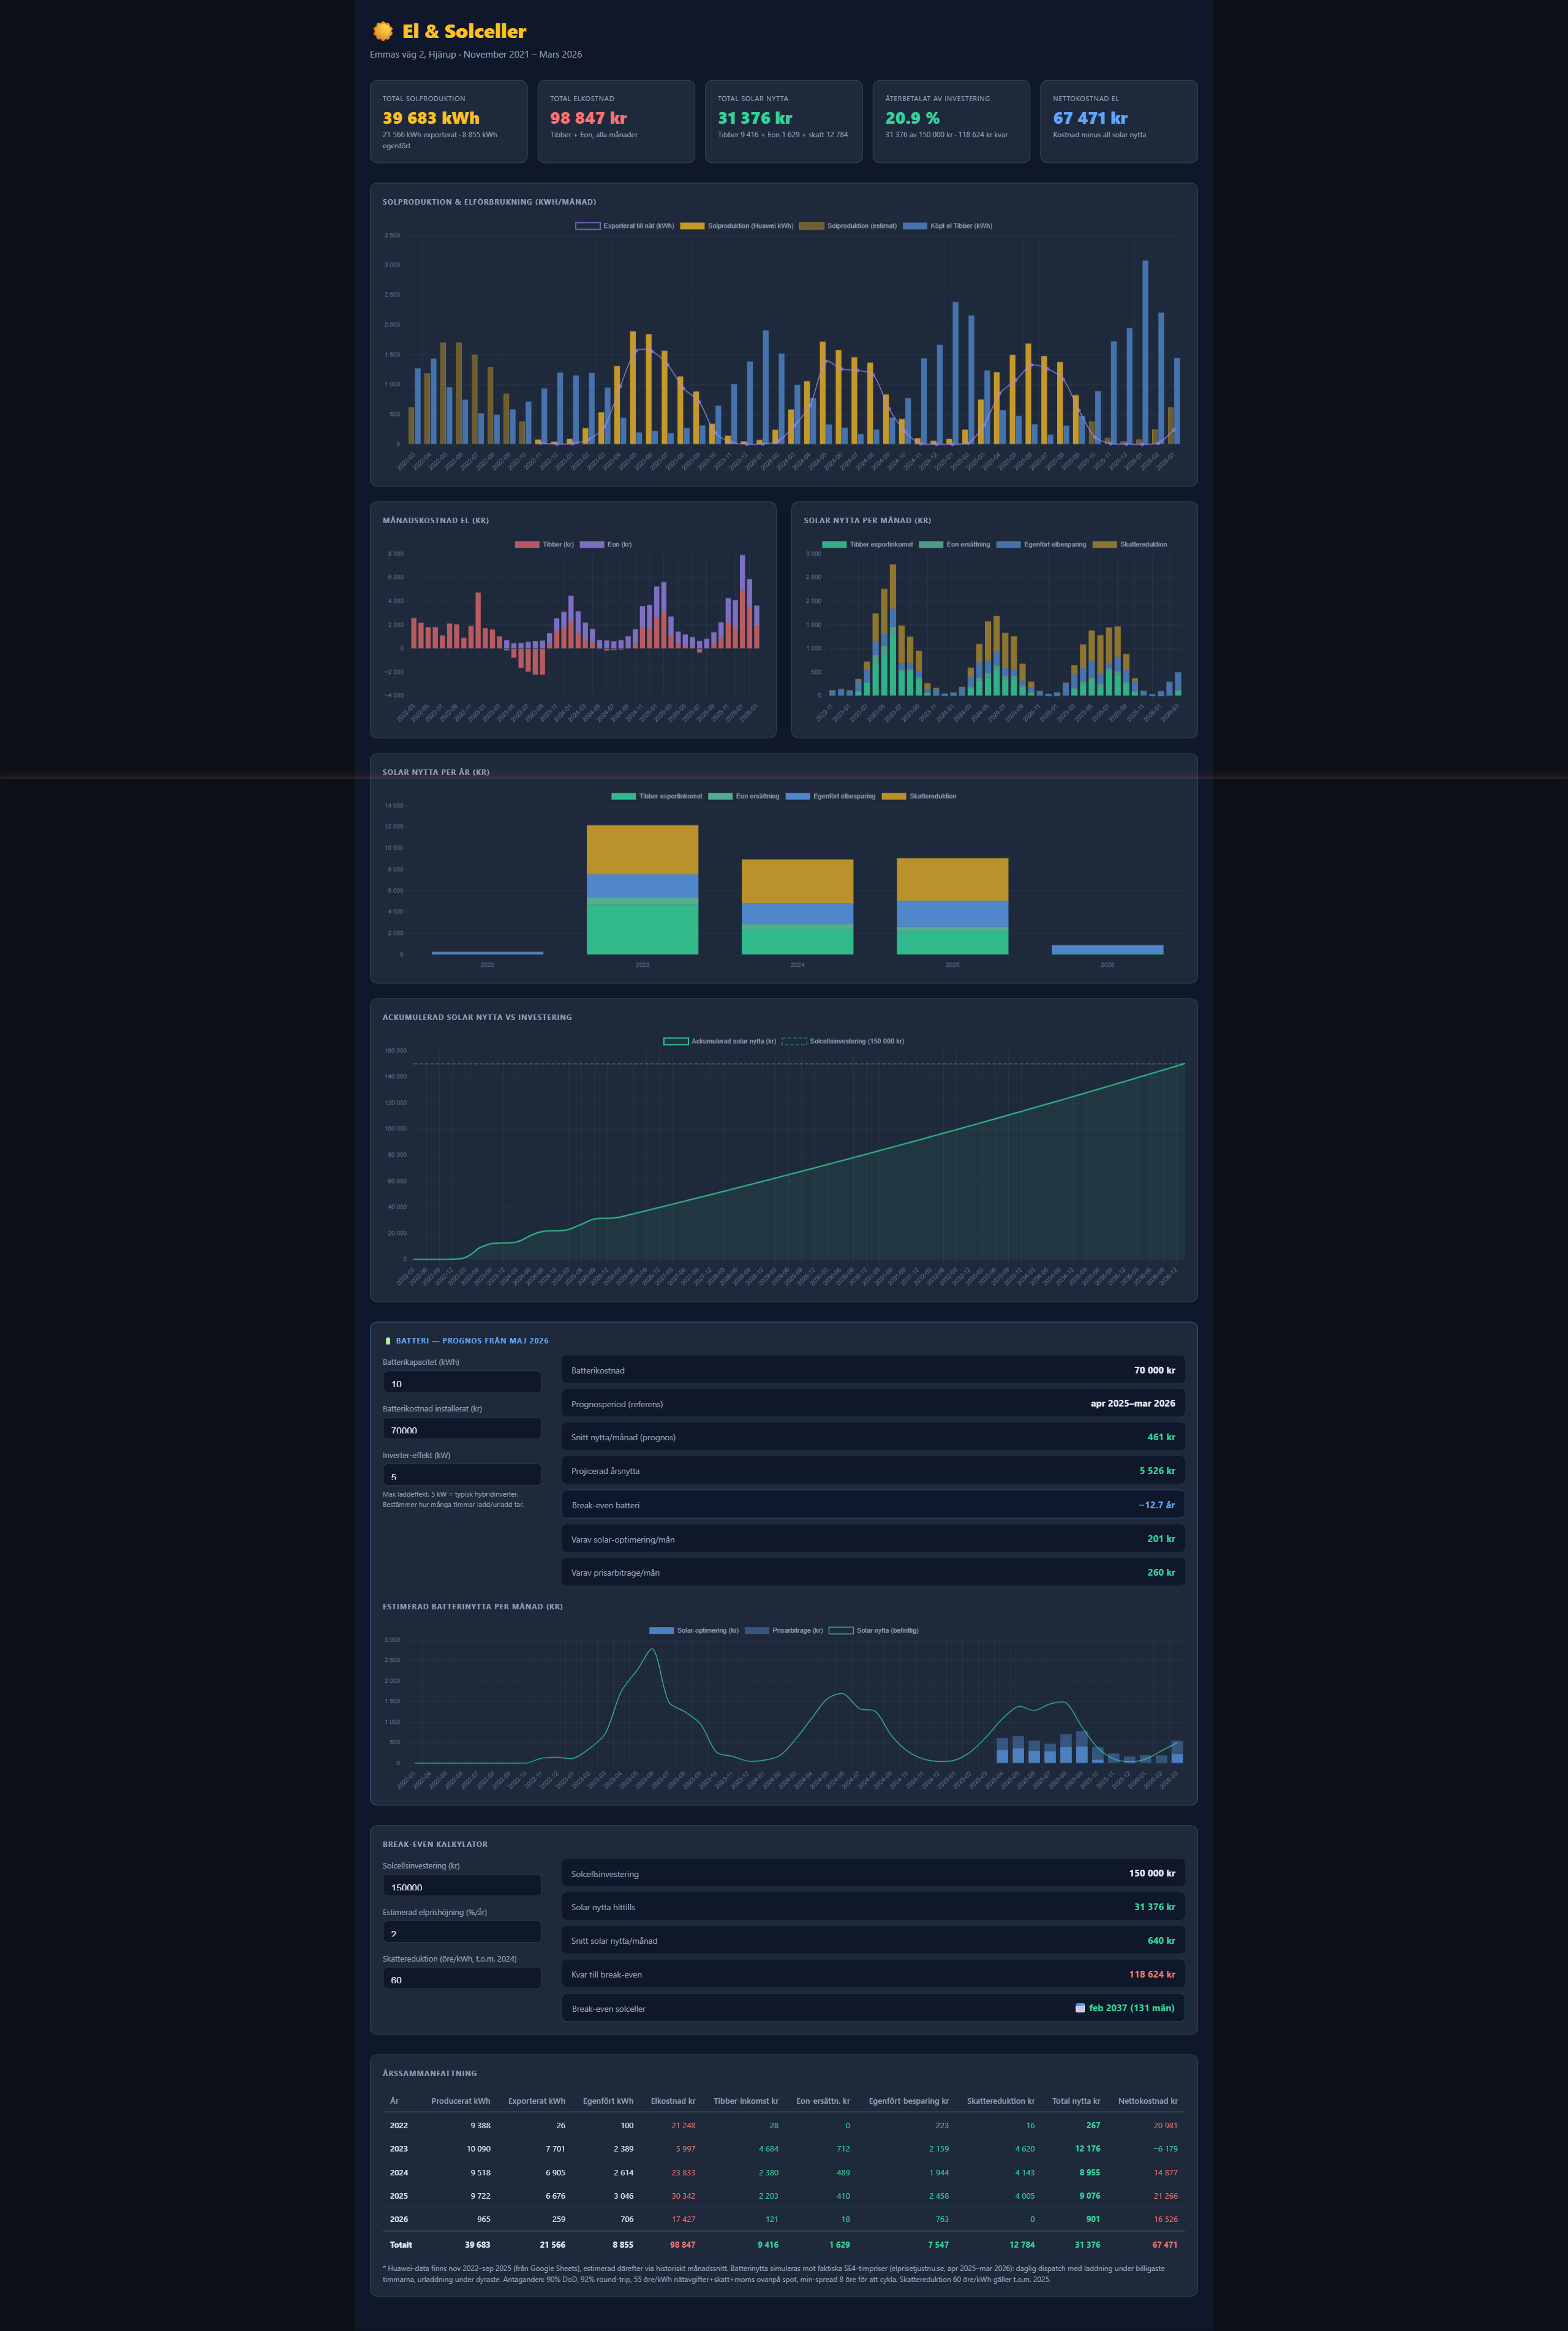
I’ve had solar panels on my roof since 2022. Over three years I’ve accumulated 49 Tibber invoices and 36 Eon invoices — two separate bills every month, one for the electricity itself and one for the grid. That’s a lot of PDFs sitting in folders doing nothing.
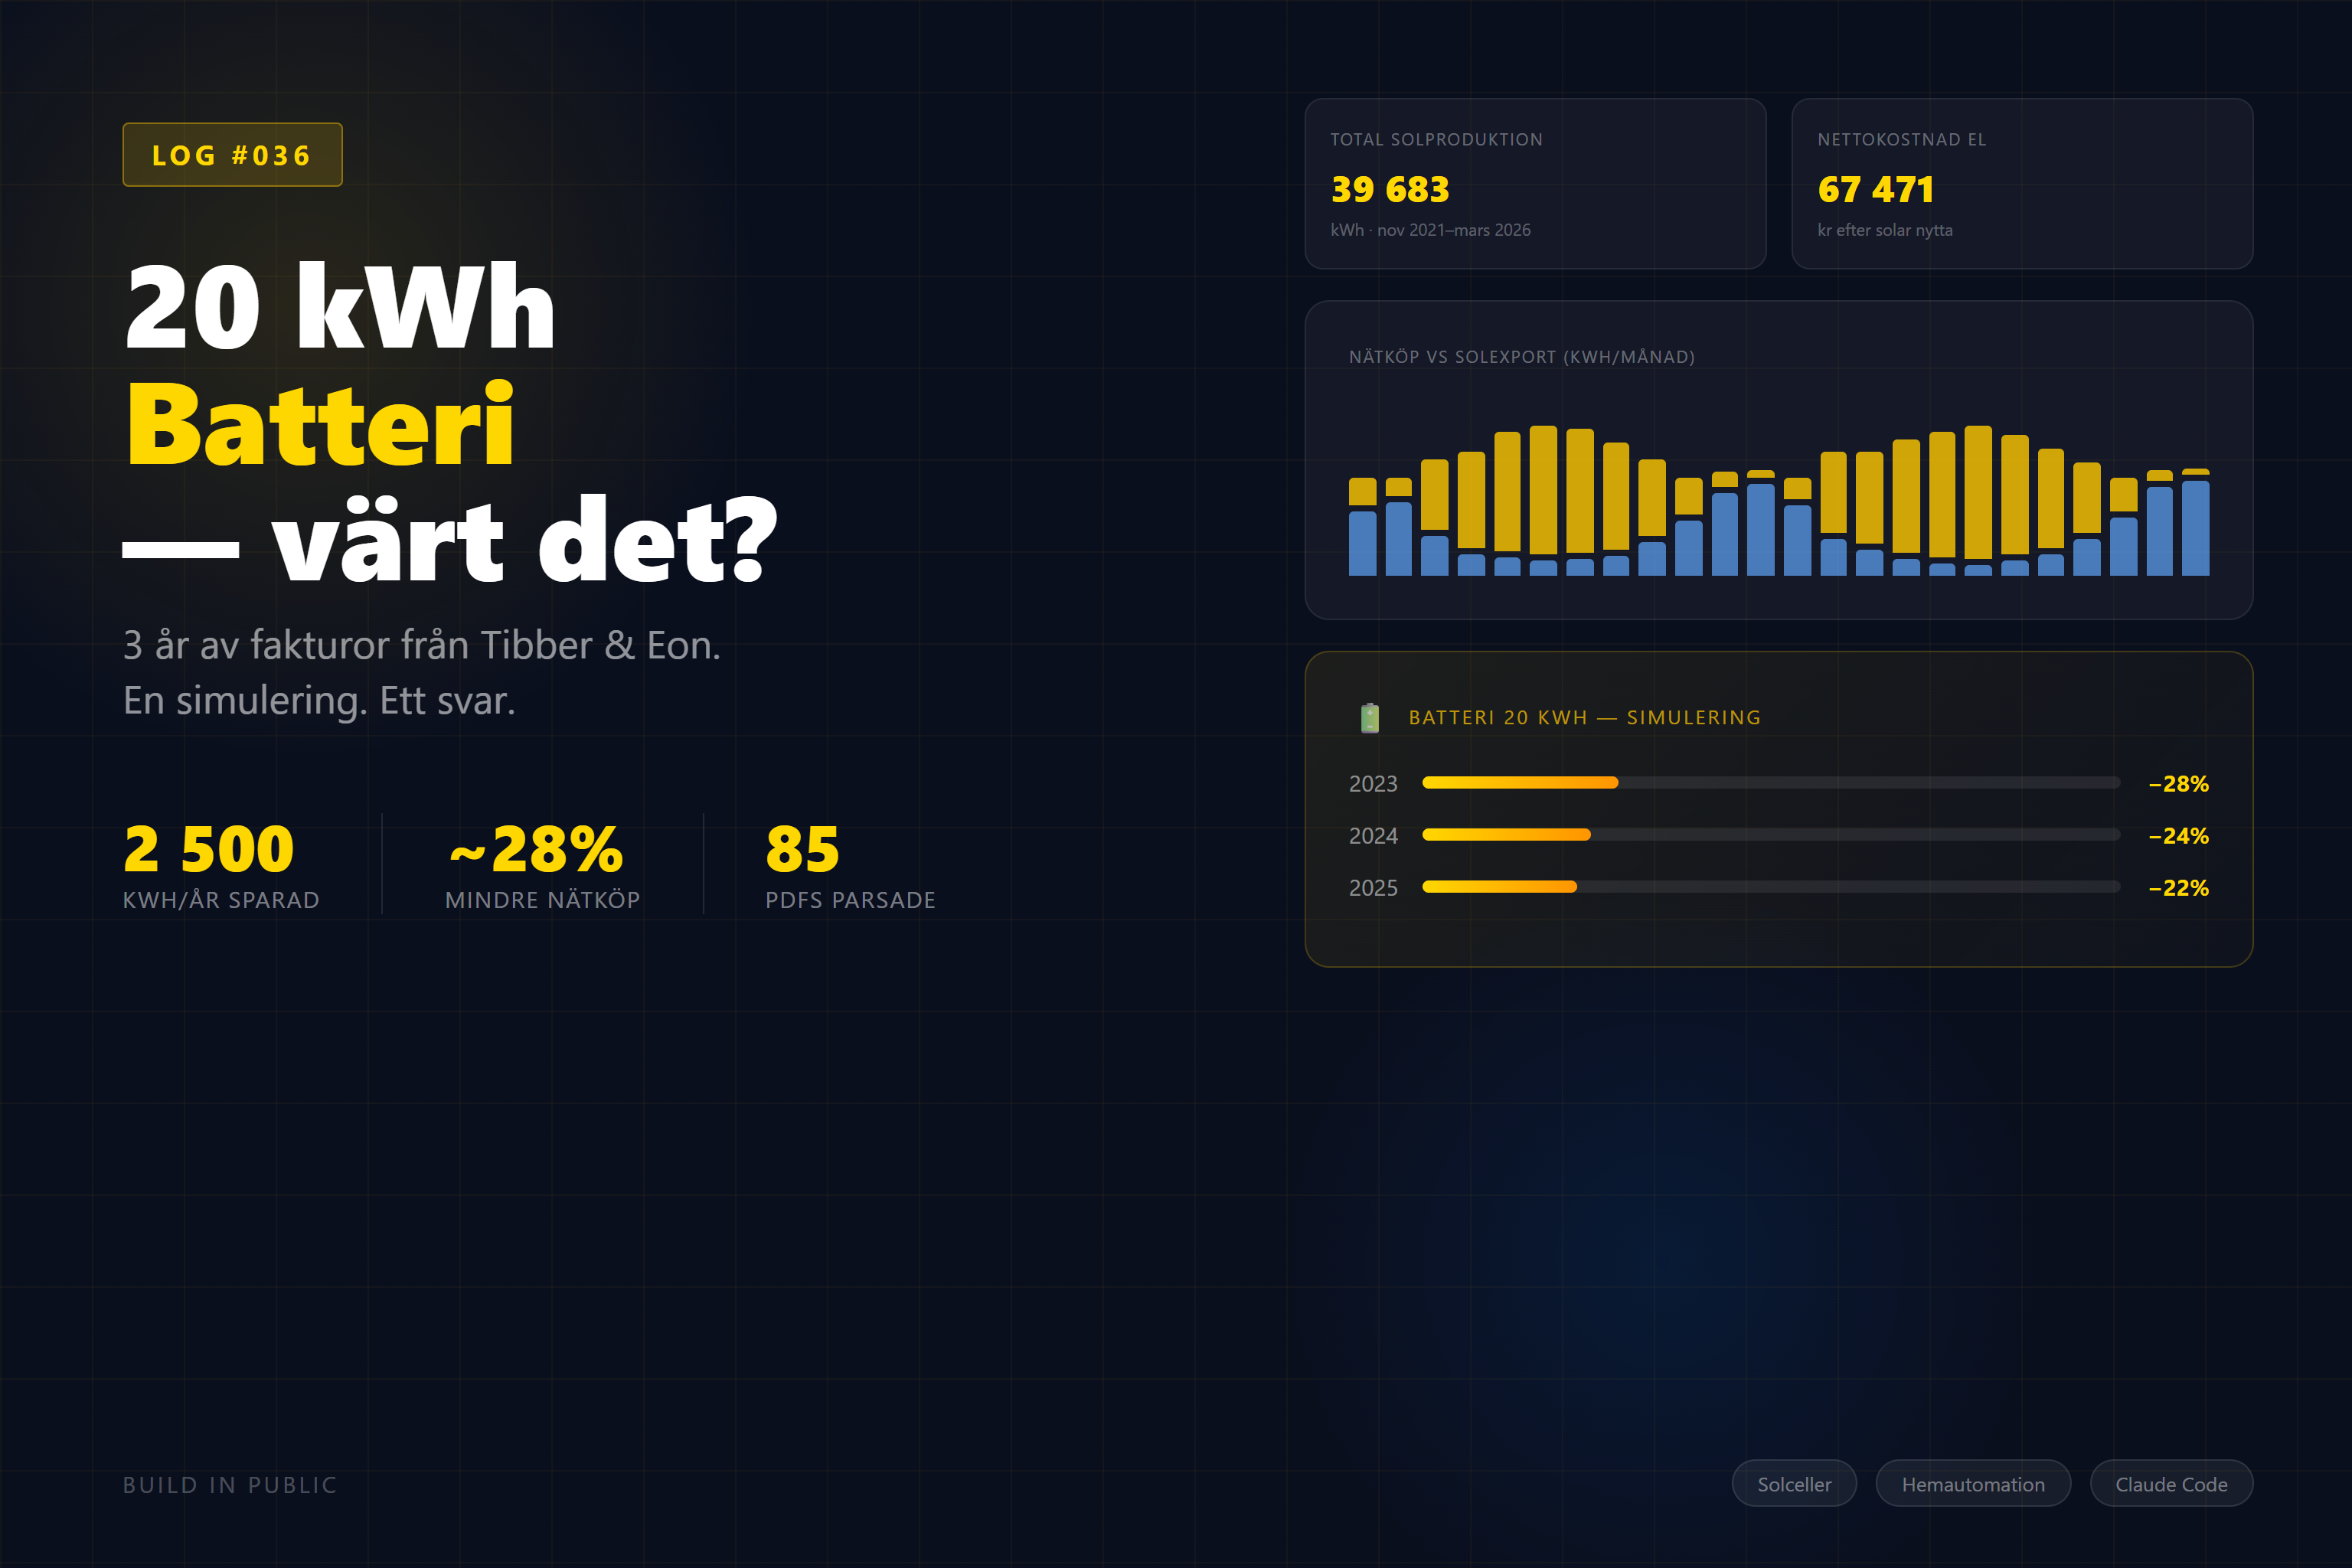
So I parsed them all into JSON and asked the obvious question: what would have happened if I’d had a 20 kWh home battery?
What changed since last log
- Built an electricity cost dashboard (
el-dashboard.html) with Chart.js — fully self-contained HTML with all invoice data baked in - Parsed all Tibber and Eon PDFs into structured JSON with Python scripts
- Ran a battery simulation on three full years of monthly data
What shipped
The battery simulation. Using monthly grid import and solar export data, I modelled a 20 kWh battery with 90% roundtrip efficiency doing one charge/discharge cycle per day:
- Daily solar surplus = monthly export ÷ days in month
- Battery captures
min(daily surplus, 20 kWh)per day - At 90% efficiency that becomes the nightly discharge
- Capped at actual grid import — you can’t save more than you bought
Results:
| Year | Grid purchase (no battery) | Reduction with 20 kWh battery |
|---|---|---|
| 2023 | 8,000 kWh | 2,213 kWh (28%) |
| 2024 | 10,574 kWh | 2,565 kWh (24%) |
| 2025 | 12,689 kWh | 2,739 kWh (22%) |
Typical year: ~2,500 kWh less from the grid.
What’s working
The biggest wins aren’t in July — they’re in March, April, September and October. In July I’m already exporting massive amounts and my grid import is tiny (161 kWh in July 2024). The battery would be full every day and couldn’t do more.
The shoulder months are where it matters: enough solar production to charge the battery, enough consumption to actually use the discharge.
At a blended electricity price of ~1.50 SEK/kWh (including grid fees and tax), 2,500 kWh saves roughly 3,750 SEK per year. With batteries currently priced around 60,000–80,000 SEK installed, that’s a 16–21 year payback — before accounting for price arbitrage or rising electricity prices.
What’s unclear or broken
The simulation has a known limitation: it uses monthly averages, not daily actuals. A sunny April day might produce 60 kWh of surplus while a rainy day produces zero. The 20 kWh battery can only capture 20 kWh of the sunny day, but the monthly average treats it as 2 kWh/day spread evenly. This probably causes slight overestimation during high-variance months.
Price arbitrage isn’t included. A battery can also charge at 2 AM when spot prices are low and discharge at 6 PM when they’re high. In Sweden’s SE4 price zone that spread can be significant. This requires hourly data — which brings me to the next step.
Decisions made
The Tibber API exposes consumption(resolution: HOURLY). With hourly data I can:
- Run a day-by-day simulation with actual numbers instead of monthly averages
- Include real spot price arbitrage using SE4 hourly prices
- Get a proper answer on battery ROI instead of a rough estimate
The API token is stored in 1Password. Previous attempt returned “invalid token” — likely needs a fresh token from developer.tibber.com. That’s the next thing to unblock.
Tooling & process
The whole analysis ran inside Claude Code. I asked it to simulate the battery impact and it wrote the Node.js calculation, caught its own bug (not capping battery benefit at actual grid import), fixed it, and returned clean per-year numbers. Total time from question to result: a few minutes.
The parsed JSON files (tibber-fakturor.json, eon-fakturor.json) are the foundation. Everything else is just querying them.
— Stefan